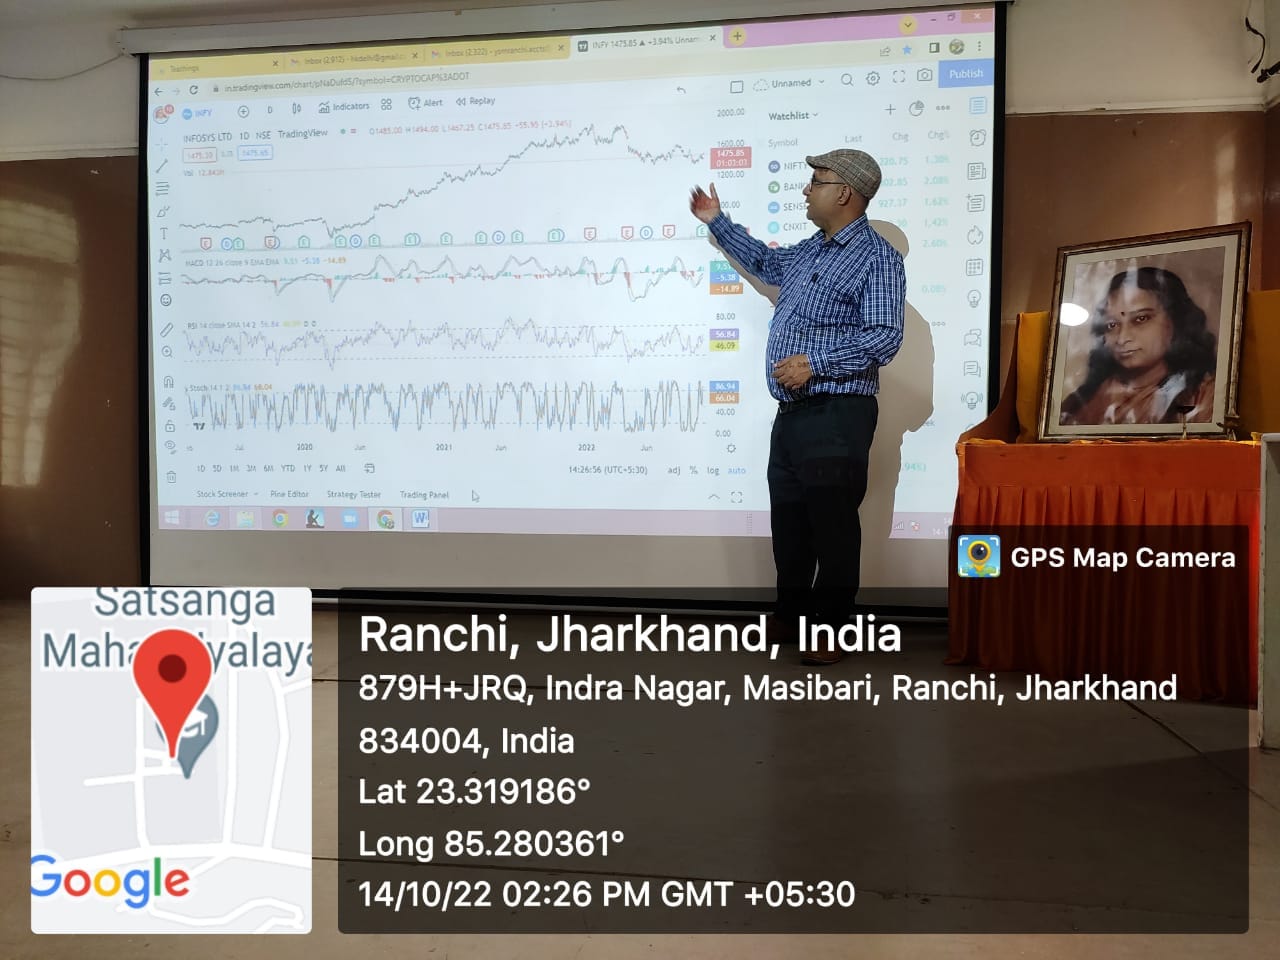
Technical analysis is a tool to predict the future price movements based on the past price and volume market data to make decision to buy, hold or sell.

To perform technical analysis:
- Gather data- Obtain historical price and volume data for the market you've selected from moneycontrol.com, yahoo finance or any other site.
- Plot the data- Use charts, preferably candlestick charts, to visualize the price data and identify trends, support and resistance levels, and chart patterns. If you don't have the software to plot the data, many stock brokers provide the charts online.
- Identify the trend- Look for patterns in the market data, such as uptrends, downtrends, and sideways trends.
- Draw support and resistance levels
- Apply indicators to establish entry and exit points- Use technical indicators such as moving averages, Bollinger Bands, and oscillators like RSI and stochastic to analyze the market and establishing entry and exit points.
- Make trading decisions- Use the information gathered through technical analysis to make informed trading decisions, such as buying, holding or selling a security.
Technical analysis is just one approach to trading and investing. It is important to consider other factors, such as fundamental analysis, valuations and market news, before making any financial decisions.
